فجوة الطاقة لشبه موصل من طيف النفاذية
Band Gap of a Semiconductor from Its Transmittance Spectrum

فجوة الطاقة لشبه موصل من طيف النفاذيةBand Gap of a Semiconductor from Its Transmittance Spectrum
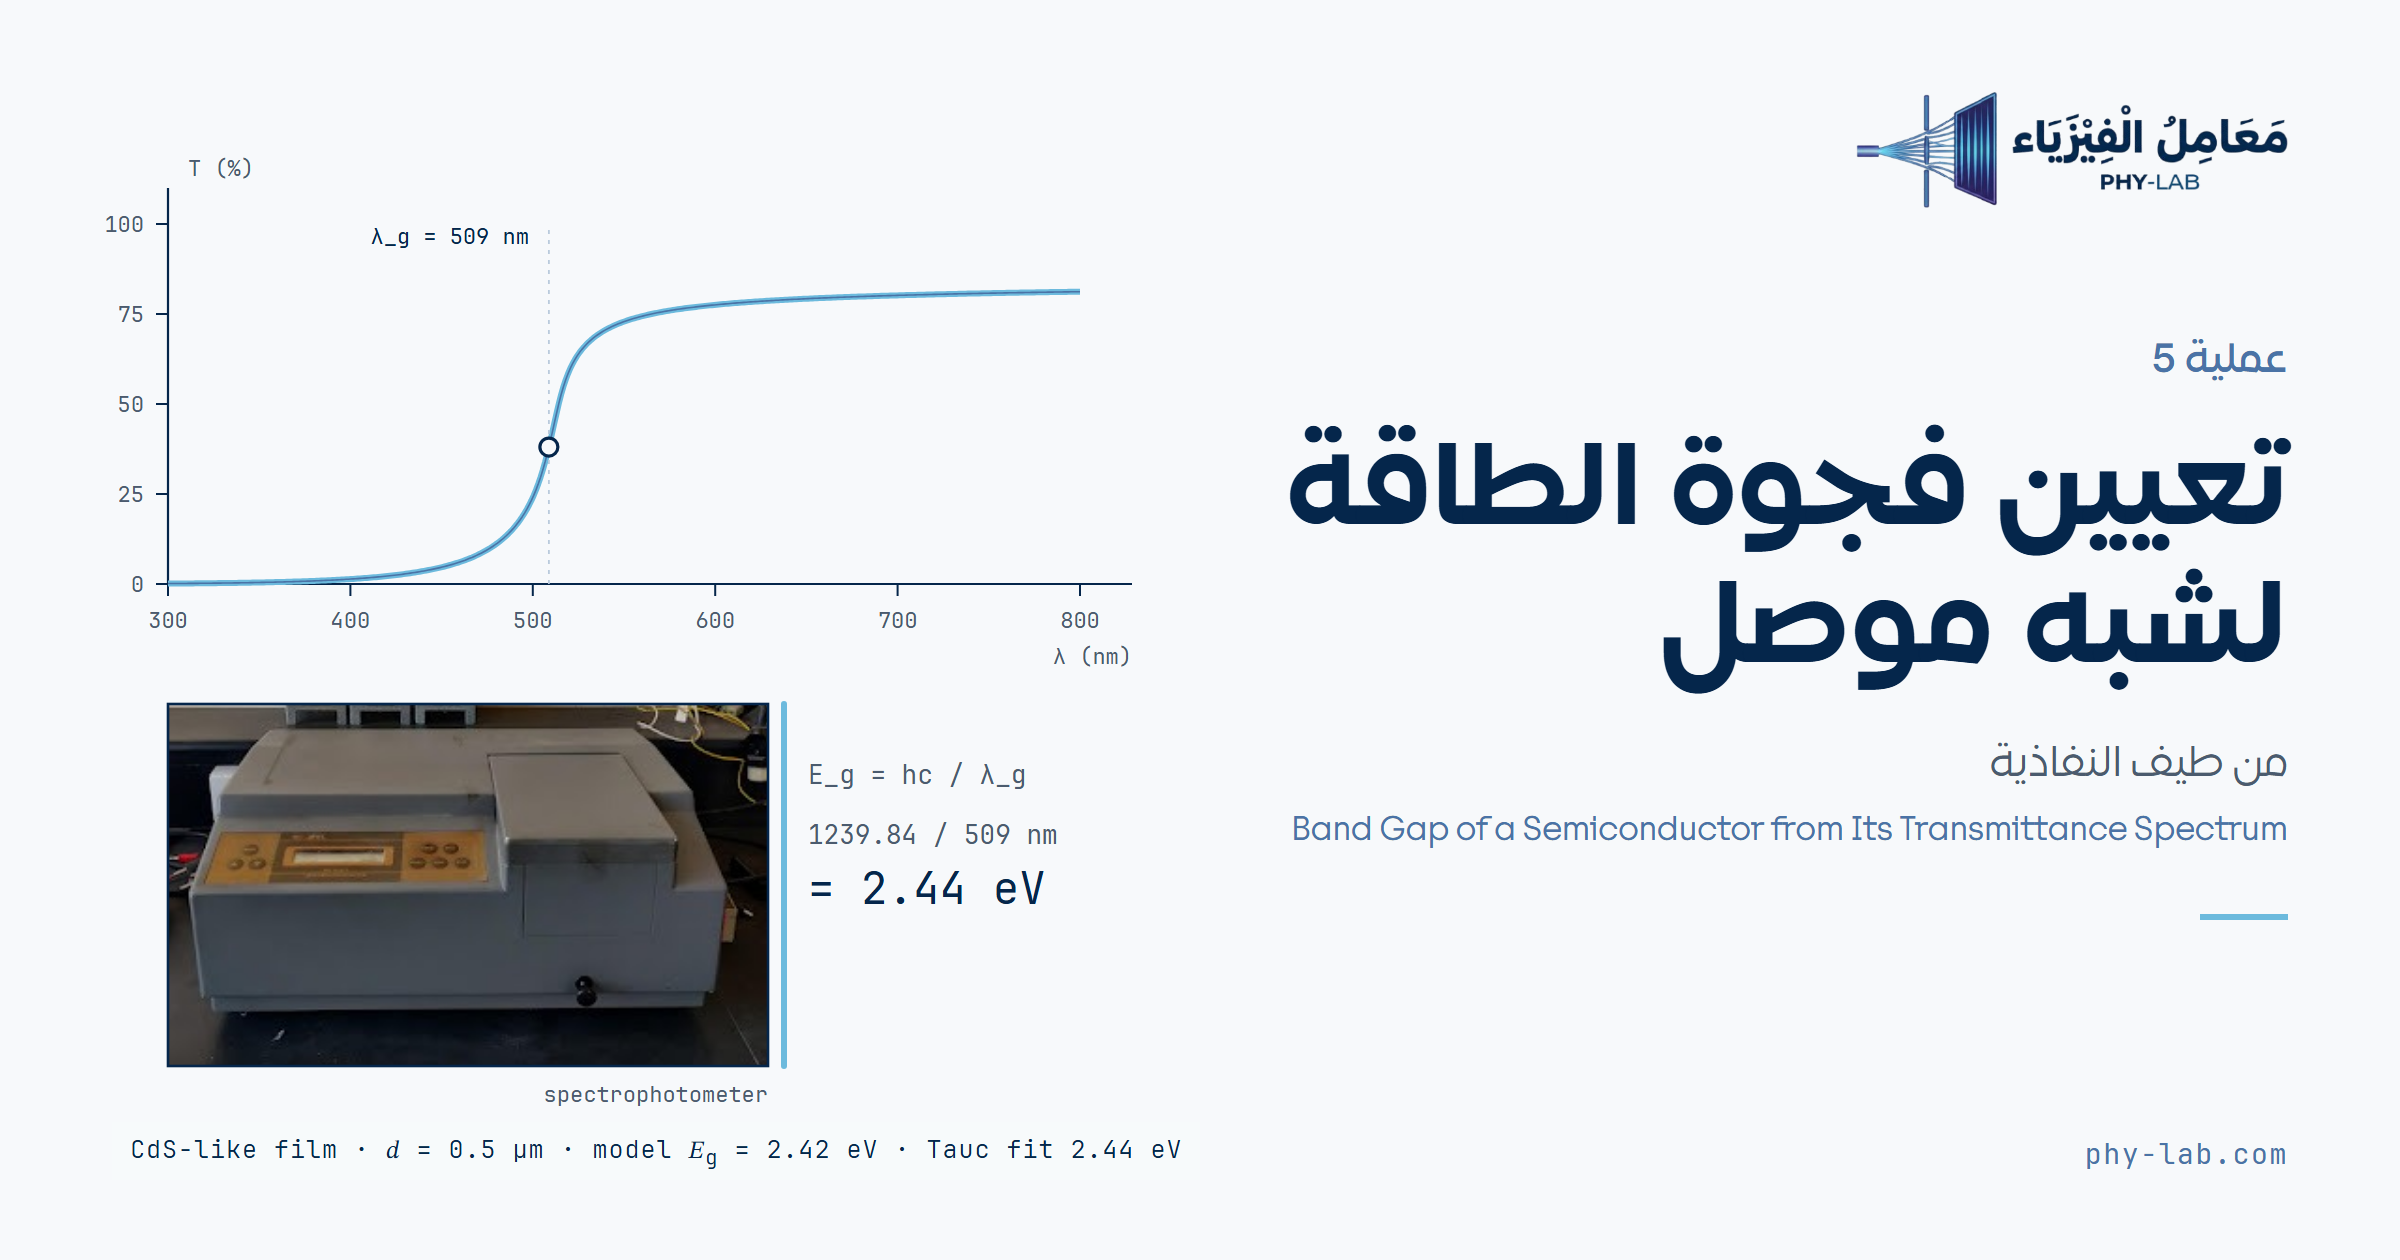
أدخل النفاذية عند كل طول موجي، وتحسب الأداة معامل الامتصاص، والطول الموجي الحرج، وفجوة الطاقة بطريقتين: حافة النفاذية ورسم تاوك.Enter the transmittance at each wavelength; the tool computes the absorption coefficient, the critical wavelength and the band gap by two methods: the transmittance edge and the Tauc plot.
الهدف والأجهزةObjective and apparatus
تعيين فجوة الطاقة الضوئية Eg ومعامل الامتصاص α لغشاء رقيق من شبه موصل على ركيزة زجاجية، من قياس نفاذيته بجهاز المطياف الضوئي في المدى 400–900 nm.
To determine the optical band gap Eg and the absorption coefficient α of a semiconductor thin film on a glass substrate from its transmittance, measured with a spectrophotometer over 400–900 nm.
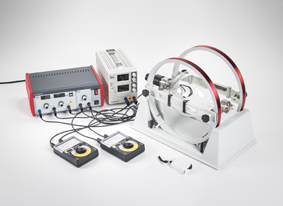
- جهاز مطياف ضوئي (Spectrophotometer)
- عينة شبه موصل على ركيزة زجاجية
- شريحة زجاج مرجعية من نوع الركيزة نفسه
- مزود قدرة
- ورقة تسجيل
- Spectrophotometer
- Semiconductor sample on a glass substrate
- Reference glass slide of the same substrate type
- Power supply
- Recording sheet
الأساس النظريTheory
تفصل فجوة الطاقة بين حزمة التكافؤ وحزمة التوصيل. الفوتون الذي طاقته أكبر من Eg يُمتص لأنه يرفع إلكتروناً عبر الفجوة، والفوتون الأضعف ينفذ. وطاقة الفوتون مرتبطة بطوله الموجي:
The band gap separates the valence and conduction bands. A photon with energy above Eg is absorbed because it lifts an electron across the gap; a weaker photon is transmitted. Photon energy is related to wavelength by:
يضعف الضوء داخل غشاء سُمكه x أُسياً (قانون بير–لامبرت). T0 هي النفاذية لو لم يكن هناك امتصاص؛ وهي أقل من 100% لأن جزءاً من الضوء ينعكس عن سطحَي الغشاء. وبأخذ T0 = 1 نحصل على الصيغة المبسطة α = (1/x) ln(1/T):
Light decays exponentially in a film of thickness x (Beer–Lambert law). T0 is the transmittance without absorption; it is below 100% because part of the light is reflected at the film surfaces. Setting T0 = 1 gives the simplified form α = (1/x) ln(1/T):
الطريقة الأولى: الطول الموجي الحرج λc هو حيث ترتفع النفاذية بأشد ميل، ومنه:
Method 1: the critical wavelength λc is where the transmittance rises most steeply, giving:
الطريقة الثانية (رسم تاوك): قرب الحافة يتبع معامل الامتصاص العلاقة التالية، حيث n = 2 للانتقال المباشر المسموح وn = 1/2 لغير المباشر. نرسم (αhν)n مقابل hν، ونمدّ الجزء المستقيم حتى يقطع محور الطاقة عند Eg:
Method 2 (Tauc plot): near the edge the absorption coefficient follows the relation below, with n = 2 for an allowed direct transition and n = 1/2 for an indirect one. Plot (αhν)n against hν and extend the straight part to meet the energy axis at Eg:
الثابت: hc = 1239.84198 eV·nm (CODATA 2018). رسم تاوك أدق من الطريقة الأولى لأنه يستعمل شكل منحنى الامتصاص كله، أما λc فدقته محدودة بخطوة القياس.
Constant: hc = 1239.84198 eV·nm (CODATA 2018). The Tauc plot is more accurate than method 1 because it uses the whole shape of the absorption curve; λc is limited by the measurement step.
خطوات التجربةProcedure
- شغّل الجهاز واتركه يسخن حتى يستقر مصدر الضوء.
- ضع الشريحة المرجعية في مسار الحزمة واضبط النفاذية على 100%. في الجهاز أحادي الحزمة أعد هذا الضبط عند كل طول موجي، لأن شدة المصباح وحساسية الكاشف تتغيران مع الطول الموجي.
- ضع العينة مكان المرجع بحيث يقع الغشاء في اتجاه الحزمة نفسه، وقِس النفاذية من 400 إلى 900 nm بخطوات 20 nm.
- سجّل القراءات في الجدول، وأدخل سُمك الغشاء.
- اضغط «احسب النتائج»، ثم قارن بين رسم النفاذية ورسم تاوك.
- Switch on the instrument and let the lamp warm up until it is stable.
- Put the reference slide in the beam and set the transmittance to 100%. On a single-beam instrument repeat this at every wavelength, because lamp intensity and detector sensitivity change with wavelength.
- Replace the reference with the sample, film facing the same way, and measure the transmittance from 400 to 900 nm in 20 nm steps.
- Record the readings in the table and enter the film thickness.
- Press “Compute results”, then compare the transmittance plot with the Tauc plot.
أمسك الشرائح من حوافها، فبصمات الأصابع تشتت الضوء وتخفض النفاذية. المدى 400–900 nm يكشف فجوات بين 1.38 و3.10 eV فقط؛ فجوة السيليكون (1.12 eV) تقابل نحو 1107 nm، فلا تظهر حافتها في هذا المدى.
Hold the slides by their edges; fingerprints scatter light and lower the transmittance. The 400–900 nm range reveals only gaps between 1.38 and 3.10 eV; silicon’s gap (1.12 eV) corresponds to about 1107 nm, so its edge does not appear in this range.
إدخال البياناتData entry
| # | λ (nm) | T (%) | α (cm⁻¹) |
|---|
البيانات الحالية توضيحية مولّدة من نموذج غشاء شبيه بـ CdSe (Eg = 1.74 eV انتقال مباشر، سُمك 200 nm، انعكاس 20%، ذيل أورباخ 50 meV، ضجيج ±0.3%) وليست قياساً.Current data are illustrative, generated from a CdSe-like film model (Eg = 1.74 eV direct, 200 nm thick, 20% reflection, 50 meV Urbach tail, ±0.3% noise), not a measurement.
لصق بيانات أو تحميل ملف CSVPaste data or load a CSV file
النتائجResults
التفسيرInterpretation